What is the behavior test of composite materials?
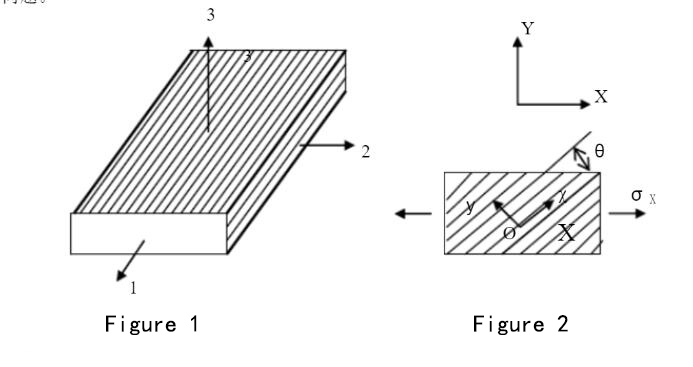
The general study of mechanics of materials is about uniformly distributed, isotropic materials, but now there is another material that is becoming more and more widely used in engineering called composite materials. It is an anisotropic material. Composites are materials with new properties made of two or more materials with different properties by physical or chemical methods, and generally the properties of composites are better than the properties of their component materials. What are the characteristics of composite materials in terms of mechanical behavior and in what ways does anisotropy manifest itself? How can anisotropic materials measure their elastic constants, what are the differences in mechanical properties between different fiber lay-up directions and different loading directions, and what are the along-axis and off-axis states?... To facilitate the study of these questions, we processed a composite plate with the reinforcing material layered along one direction (as shown in Figure 1). Since the reinforcement is unidirectional, it evades many of the complex issues in composite research.
The specific material mainly studied in this experiment is a glass fiber unidirectional reinforced composite. The modulus of elasticity of glass fiber is about 80~85 GPa and the matrix is epoxy resin, whose modulus of elasticity is about 3~5 Gpa. its volume ratio of fiber to epoxy resin is about 1;1. also provided are bi-directional reinforced composites (orthogonal reinforcement) with a ratio of 18:14 fibers in both directions and some metallic materials.
I. Experimental principle and test method
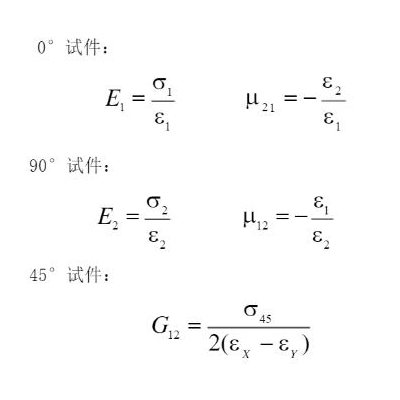
The elastic constant of a material is a fundamental parameter to describe the mechanical properties of a material. As a characteristic value to measure the stiffness and elastic deformation behavior of a material, it is a very important index in theoretical calculation and engineering design. Familiar materials, such as metals, are isotropic materials with two independent elastic constants, namely the Young's modulus of elasticity E and Poisson's ratio u (or shear modulus of elasticity G). Composite materials, on the other hand, have increased independent elastic constants due to their prominent anisotropic nature. To determine the elastic constants of composites, the material under test was processed into three specimens with fibers at 0°, 45° and 90° to the loading direction. The strains in three directions, i.e., longitudinal, transverse, and 45" directions, were measured for each specimen by applying resistive gauges. The strain gauges are connected to the measuring bridge in a certain way, and the strain signals can be read directly from the digital static strain gauge at a fixed point or the load and strain data can be automatically recorded by the data acquisition system. The experimental data are processed by linear regression and the elastic constants of the composite material are calculated according to the following equation:
The definition of coordinates is represented in Figure 2. The coupled shear strain is a mechanical property of the composite material in the off-axis stress state. In order to study and measure the coupled tangential strain, strain gauges were attached to the specimen in the 0° and 90° directions in addition to the 45° direction. We were able to understand the difference and the characteristics of the two stress states of the composite material, i.e., along-axis stress (O°, 90°) and off-axis stress (45°), and to measure the coupled shear strain experimentally.
1. Specimen processing
A standard tensile specimen is machined from the composite plate at 0°, 45° and 90°. The shape of the specimen is shown in Figure 3, and the nominal dimensions of the specimen are t=2.5-5mm in thickness and b=25mm in width, and the specimen is reinforced with aluminum or glass steel sheets at both ends.
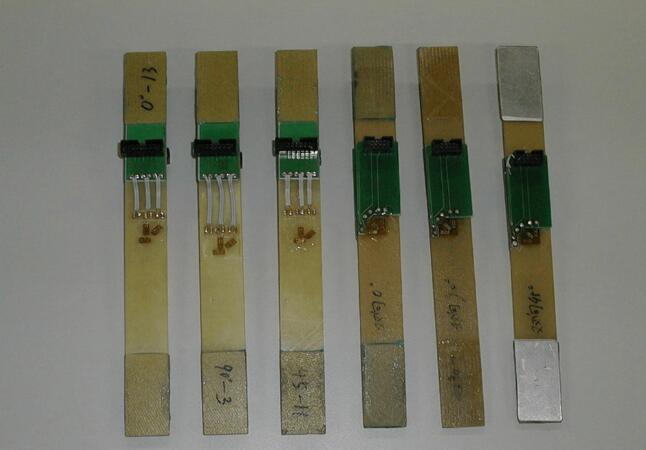
Figure 3
The test piece name definition method is as follows:
1). Unidirectional composite
0° specimen is in the direction of the fiber (longitudinal);
90° test piece is perpendicular to the direction of the fiber (transverse);
45° specimen is oriented at 45° with the fiber (45° off-axis).
2). Orthogonal composite
0° specimen is in the direction of the main fiber (longitudinal);
90° specimen - perpendicular to the direction of the main fiber (transverse);
The 45° specimen is oriented at 45° to the main fiber (45° off-axis).
2. Description of strain measurement method and coupling
The strain of the specimen is measured by resistance strain gauges. The resistance value of the resistance gauges is 120Q, the sensitivity coefficient K g is 2.08, and the transverse correction coefficient H=1.2%. The resistance gauges are symmetrically pasted on the front and back sides of the specimen, and three resistance gauges are arranged on each side in the directions of 0. (loading direction), 90° (vertical loading direction) and 45° (45° from the loading direction) ε0,ε90 and ε45.
To facilitate the coupling measurement, a coupling plate and 14-pin socket are fixed above the patch position (see Figure 3). The upper and lower pins of the socket are shorted together, using six groups of them, to connect the six lead wires of the resistor tabs in each of the three directions in sequence. For the measurement, a row of wires with a 14-pin plug, whose plug is connected to the socket, is connected with 12 wires, and every two adjacent ones are connected together, forming 6 output wires corresponding to the three strain gauges respectively.
II. Experimental objectives:
1. To master the method of testing the elastic constants of composite materials.
2. To determine the five elastic constants of composite materials, E1,E2,μ12,μ21 and G12.
3.To know the characteristics of anisotropy of composite materials.
4. to understand the mechanical properties of the composites in different fiber lay-up directions and different loading directions.
5. to study the relationship between E1,E2,μ12and μ21 in the along-axis properties;
6.To study the coupled shear phenomenon during off-axis loading.
7. To study the measurement method of coupled shear strain.
III. Experimental equipment and test pieces
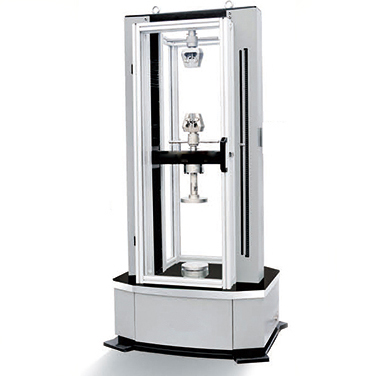
1、Electronic universal testing machine
2. A group of unidirectional reinforced composite specimens
3. 0°, 45° and 90° specimens with strain gauges attached to the specimens.
4、Multi-channel signal preamplifier and data acquisition system
5. Multi-channel digital static strain gauge;
5. 0.02mm vernier calipers.
IV. Test procedure
The material under test is a unidirectional reinforced composite material, and the performance of the specimen in each direction is very different. Be sure to pay attention to the protection of the test specimen during the installation and loading process. Before the test, the data table required for the experiment should be designed, the size of the specimen should be measured accurately, and the maximum experimental load Pmax of the specimen should be given according to the permitted stress of the material under test and the strain measurement range of the strain gauge.
1. Computer sampling method
The six resistive gauges on the front and back sides are connected to the six channels of the static strain gauge. Each channel is equipped with four terminals, corresponding to A, B, C and D. The test is performed in a single-arm measurement mode, with the working gauges connected at A and B, and the temperature compensation gauges connected at B and C. Turn on the computer power, run the teaching software of material force test in windows environment, select "elasticity constant determination experiment" to automatically enter the test signal display and test machine control interface.
In the "experimental conditions", set the variable nature of each strain gauge channel to "single arm". Set the strain display to zero for each channel before the experiment. Select low speed, press "Start" to load slowly, the computer automatically collects and records the load, displacement and six strain signals until the maximum load of the experiment is reached. Press "End" to stop loading and sampling automatically. After the experiment, the data can be saved as data files and copied to the floppy disk, and the data can be processed by other software, or you can go to the data processing interface and observe the relationship curves, and if necessary, find out the slope of the selected curve and print out.
2. Digital strain gauge reading method
First, select the bridging method, then connect the strain gauge leads to the bridge box of the strain gauge according to the set bridging method. The test piece is loaded once at a slow speed and unloaded to the initial load. Record 5-10 sets of load and strain data in a graded loading mode. The best set of data is selected and linear regression is performed by least squares to find out the slope of the curve. Take care to select the appropriate loading range, within the maximum experimental load Pmax, and determine the initial load P and final load Pyv according to the specific conditions. load speed should be controlled, reduce the loading speed when approaching the control parameters and take readings in time. When recording the data, always check whether the strain increments are linear. The test should be repeated at least twice, and if the data is stable and repeatable to be good.
V. Test data organization
1. The load and axial strain data and axial strain and transverse strain data of each specimen are processed by least squares method.
Calculate E1,E2,μ12,μ21和 and G12. for the material under test and analyze the results to discuss whether there is a quantitative relationship between the four constants of E1,E2,μ12and μ21.
2. According to the parameters of the tested materials, the modulus of elasticity of glass fiber E=85Gpa, the modulus of elasticity of epoxy resin E=5Gpa, and the modulus of elasticity of fiber and epoxy resin E=5Gpa.
5Gpa and the volume ratio of fiber to epoxy resin 1:1, calculate the theoretical values of elastic modulus E and Ez, and compare them with the experimental results to analyze the possible reasons for the differences.
3. Calculate the coupled shear strain yy at P=2KN for unidirectional and orthotropic composites, and explain whether the shear strain
4.Can the coupled shear strain Yxy be directly observed or accurately determined from the experimental data, and is the experimental value consistent with the calculated value, and what does the error indicate?
The strain curve is plotted on coordinate paper.
5.Compare the composite material with the general metallic material and explain the characteristics and anisotropy of the fiber-reinforced composite material.
6.Organize the data and complete the complete experimental report.